
Introduction:
In today’s world, computer networks form the backbone infrastructure of many organizations. These networks represent a complex structure where multiple devices communicate. However, managing and securing these networks is a critical concern for system administrators. In this article, we will explore how to perform network scanning and discovery operations using Python programming language and popular tools Nmap and NetworkX libraries.
Learning Objectives:
- Understand the basic functionalities of Nmap and NetworkX libraries.
- Perform network scanning and visualization operations using Python programming language.
- Understand fundamental concepts in network security and management.
What are Nmap and NetworkX?
- Nmap: Nmap is a free and open-source network scanning tool used to discover targets on the network and detect security vulnerabilities. Nmap supports a wide range of scanning techniques and has a large user base.
- NetworkX: NetworkX is a network analysis library for the Python programming language. This library provides a set of tools to implement graph theory concepts and is used to manipulate graph data structures and algorithms.
Purpose of Visualization and Code Description:
The Python script we’ve written scans network devices within a specified IP range using Nmap and utilizes the NetworkX library to visualize the connections between these devices based on the scanning results. This script follows the steps below: (Understanding Encapsulation in Programming)
- 1. Importing Libraries:
import nmap
import networkx as nx
import matplotlib.pyplot as plt
Here, the necessary libraries are imported. nmap is the library used for network scanning; networkx is used for creating and manipulating network graphs; matplotlib.pyplot is a submodule of matplotlib used for visualizing the network graph.
- 2. Defining the
NetworkScannerClass:
class NetworkScanner:
    def __init__(self, ip_range, top_ports=1000):
        self.ip_range = ip_range
        self.top_ports = top_ports
        self.scan_results = None
        self.network_graph = None
A class named NetworkScanner is defined. This class will be used for performing network scanning and processing the results.
- 3. Defining the
scan_networkMethod:
def scan_network(self):
        nm = nmap.PortScanner()
        nm.scan(hosts=self.ip_range, arguments=f'-T4 --top-ports {self.top_ports}')
        self.scan_results = nm
This method is used to scan network devices within the specified IP range using the Nmap library. The scan results are assigned to the self.scan_results variable.
- 4. Defining the
create_graphMethod:
def create_graph(self):
        if self.scan_results is None:
            raise ValueError("Scan results are not available. Please run scan_network() first.")

        G = nx.Graph()
        for host in self.scan_results.all_hosts():
            if self.scan_results[host].state() == "up":
                G.add_node(host)
                for proto in self.scan_results[host].all_protocols():
                    for port in self.scan_results[host][proto].keys():
                        G.add_edge(host, f"{host}:{port}")
        self.network_graph = G
This method creates the network graph based on the scan results. Each device is represented as a node, and the connections between devices are represented as edges.
- 5. Defining the
visualize_graphMethod:
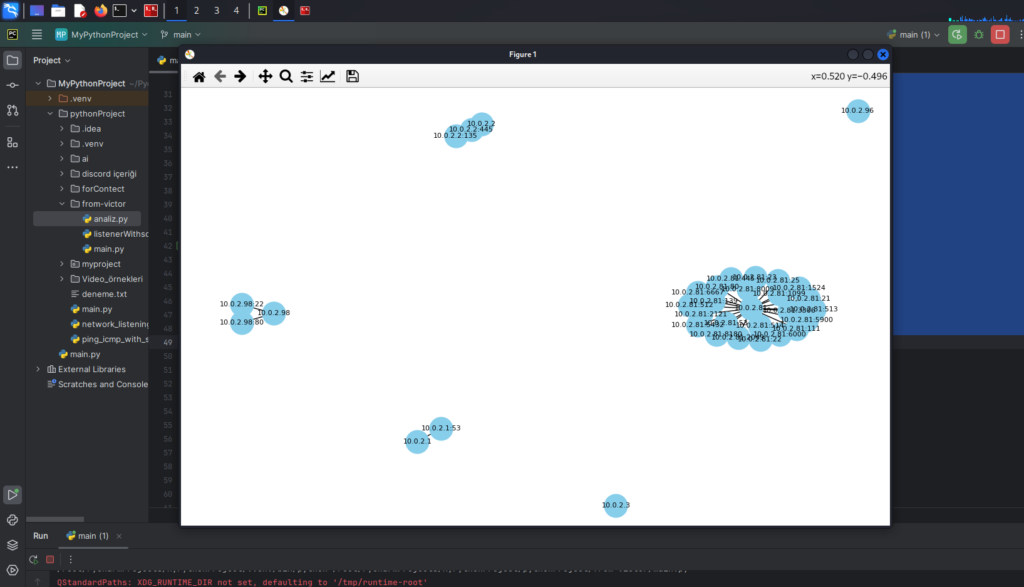
def visualize_graph(self):
        if self.network_graph is None:
            raise ValueError("Network graph is not available. Please run create_graph() first.")

        plt.figure(figsize=(12, 12))
        pos = nx.spring_layout(self.network_graph)
        nx.draw(self.network_graph, pos, with_labels=True, node_size=700, node_color='skyblue', font_size=8)
        plt.show()
This method visualizes the created network graph and displays it as output.
- 6. Usage Example:
if __name__ == "__main__":
    ip_range = '10.0.2.0/24'  # Example range, change as needed

    scanner = NetworkScanner(ip_range)
    scanner.scan_network()
    scanner.create_graph()
    scanner.visualize_graph()
Here, an example demonstrating the usage of the NetworkScanner class is provided. A scan is performed within a specified IP range, followed by the creation and visualization of the network graph.
Conclusion:
Performing network scanning and visualization operations using Python programming language with Nmap and NetworkX libraries can greatly simplify tasks for network administrators and security experts. The provided code example can serve as an effective tool for them to scan and visualize their networks. Additionally, this example can be a starting point for those who wish to gain further knowledge in the areas of network security and management.
🎉 A big shoutout to Victor for providing the awesome source code! Connect with him on LinkedIn here.
Join our Discord community here with emojis! 🚀🌟🎊
Top very post
I loved as much as you will receive carried out right here The sketch is tasteful your authored subject matter stylish nonetheless you command get got an edginess over that you wish be delivering the following unwell unquestionably come further formerly again as exactly the same nearly very often inside case you shield this hike